

AgRisk Viewer
Managing your agricultural risk in a changing climate
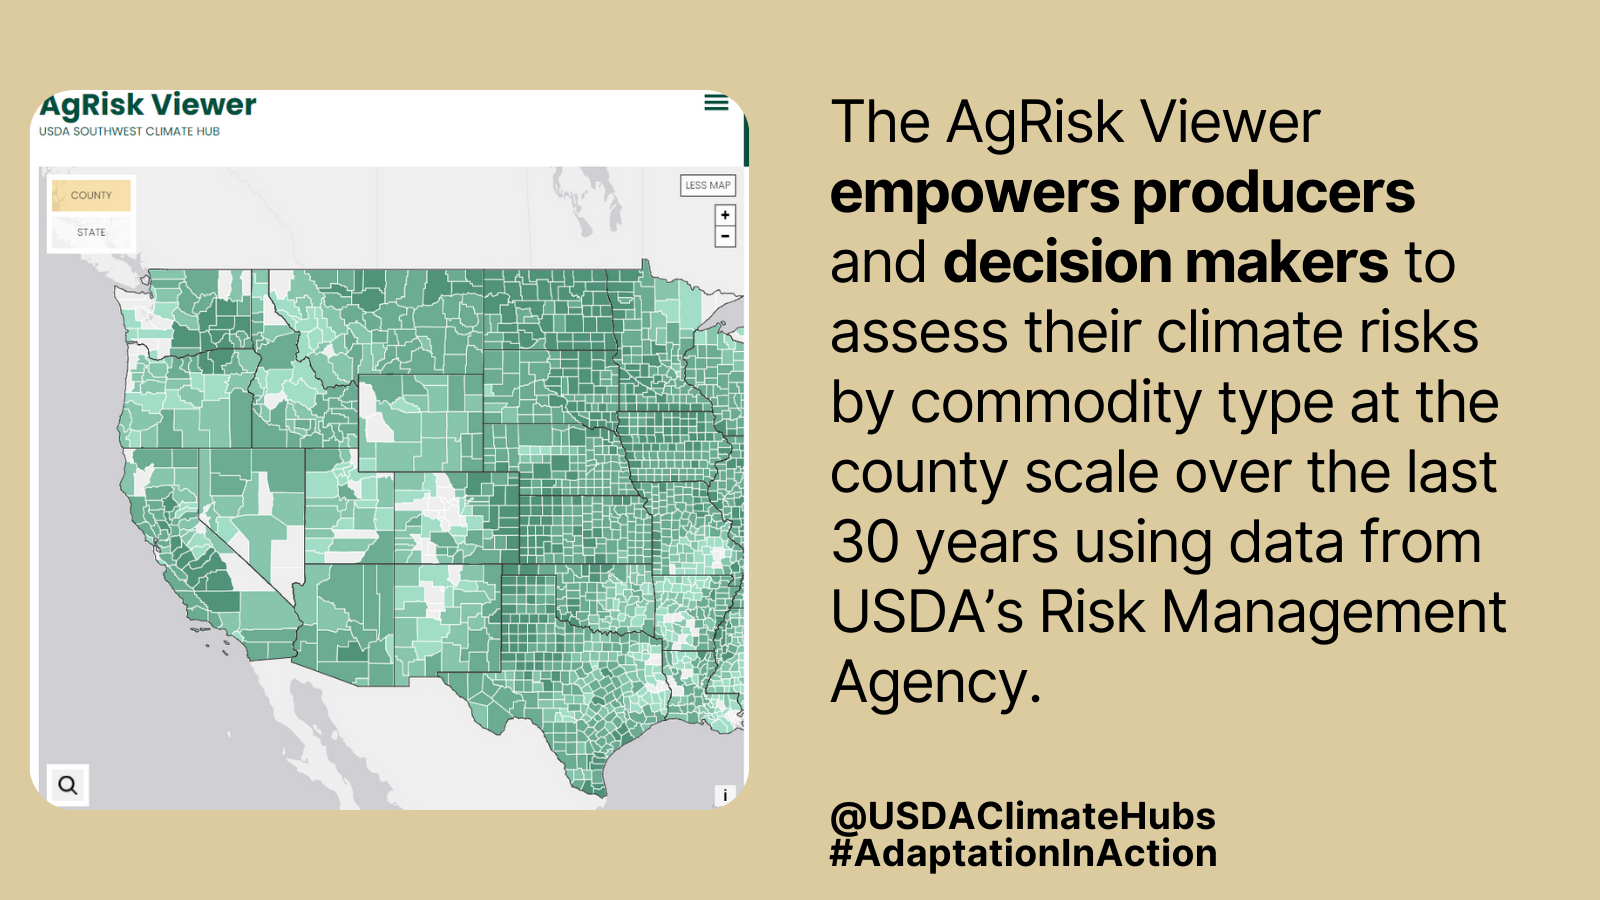
The AgRisk Viewer provides an accessible and discoverable web platform for crop insurance loss data from the U.S. Department of Agriculture (USDA) Risk Management Agency (RMA). Data are available from the county to national scale on a monthly to multi-year timestep.
In 2016 alone, over $100 billion worth of crops were insured by the federal crop insurance corporation administered through USDA RMA. This program is essentially a safety net for farmers to mitigate natural perils (e.g., drought) and price decline effects on agricultural production. Data are available from the USDA RMA on insurance payouts, or indemnities. These data also report the specific causes of loss, or reasons for crop loss, that triggered indemnities.
The AgRisk Viewer brings “to life” publicly-available cause of loss data from the USDA RMA. The viewer allows user-defined selection and visualization of several dataset components: spatial resolution (i.e., county-level, state-level, national), temporal resolution (i.e., monthly, annual), time period (1989-2016), cause of loss (e.g., drought, excess moisture, hail, wind, etc.), commodity (e.g., wheat, soybeans, corn, etc.), and variable of interest (e.g., indemnity, acres affected).
Three outcomes are associated with the development of the AgRisk Viewer:
1. Increased accessibility, discoverability, and usability of crop insurance loss data by our partners and stakeholders,
2. Co-creation of research questions and projects using crop loss data to identify those agricultural production risk “hot spots” leading towards targeted adaptation,
3. Sustained engagement with our USDA sister agencies including the RMA and their regional offices, as well as cooperative extension, land grant universities, commodity groups, and the broader public.
Citation: Reyes, J. and E. Elias. 2019. Spatio-temporal variation of crop loss in the United States from 2001 to 2016. Environmental Research Letters, 14(7). doi: https://doi.org/10.1088/1748-9326/ab1ac9